
Related Reports:
Within this series we have addressed the 3 basic financial statements to disclose what they are, what they mean, and how to use them. They form the basis of the financial reporting package for a company. There are, however, a number of other financial reports that help the business owner delve into specific aspects of their operation. Here are a number of them that you may also find useful:
The Accounts Receivable Aging lists all customer accounts that have open balances and identifies how long they have been outstanding. The report is intended to highlight customers who have not paid their bills on time. It may be that they are dissatisfied with the product or service or that they are having cash flow issues of their own. In either case, proactive efforts can isolate the problems and work toward a timely resolution.
The Accounts Payable Aging is the reverse of the A/R Aging in that it shows the business owner the bills he has not yet paid and when they are due. It is a key element of cash planning so that bills can be paid on time. At the same time, it will highlight any open credit balance so refunds can be requested.
The Gross Margin Analysis matches the cost of delivering products and services to the associated revenue derived from the sale to show how much money each product or service is contributing to the cost of operating the organization. On an individual basis, the gross margin of each product or service should be a primary consideration for setting prices and discounting practices. In total, a company’s gross margin is a key indicator of its profit potential.
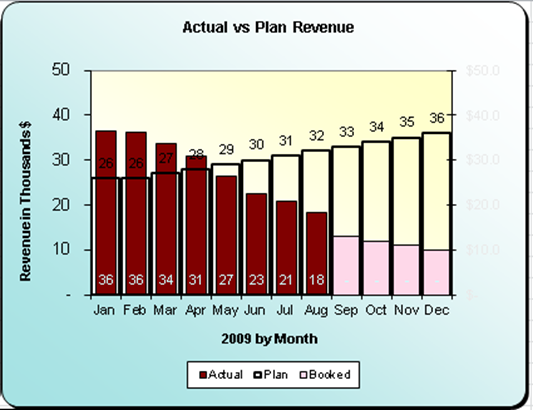
Comparison to Budget or Forecast – Reports that measure the differences between actual results and the original budget or monthly forecast of those results are useful not only as performance indicators but can also reveal flaws in the models used to generate the projections.
A Dashboard is a collection of key metrics that management monitors to maintain their visibility of current business drivers. The presentation is typically graphic in nature for instant visual impact and should be limited to a single page. The components of the dashboard will be unique to each company and may even change from year to year depending on the current strategies in play. Examples of dashboard components are:
Year-to-Date Revenue in dollars and as a percentage of the annual goal
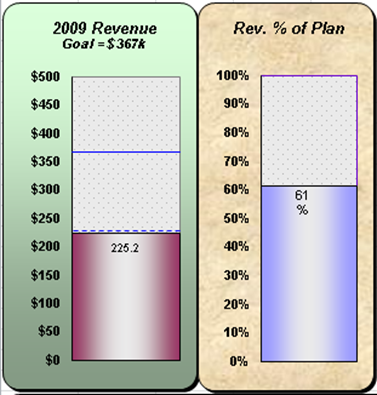
Year-to-Date Revenue in dollars and as a percentage of the annual goal
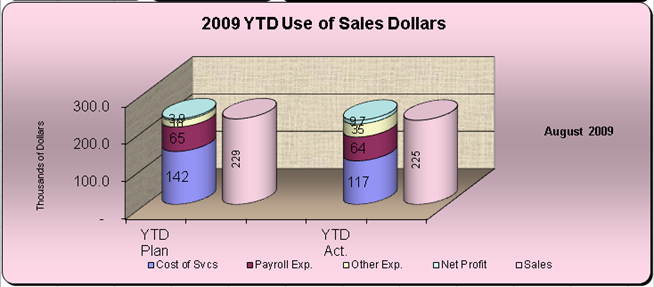
Allocation of Sales dollars by type of expense
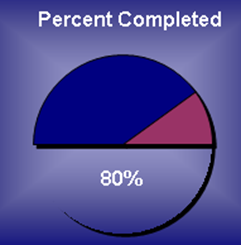
Progress on a major project
Others can be simple data tables or line graphs:
- Number of leads, proposals and closed deals (or new customers)
- Days of Receivables
- Sales per Full Time Headcount
- Inventory Days and Turnover
We hope this series has clarified each of the financial statements and what they reveal about a company. If you have questions or comments about these or other reports, please post them below.